

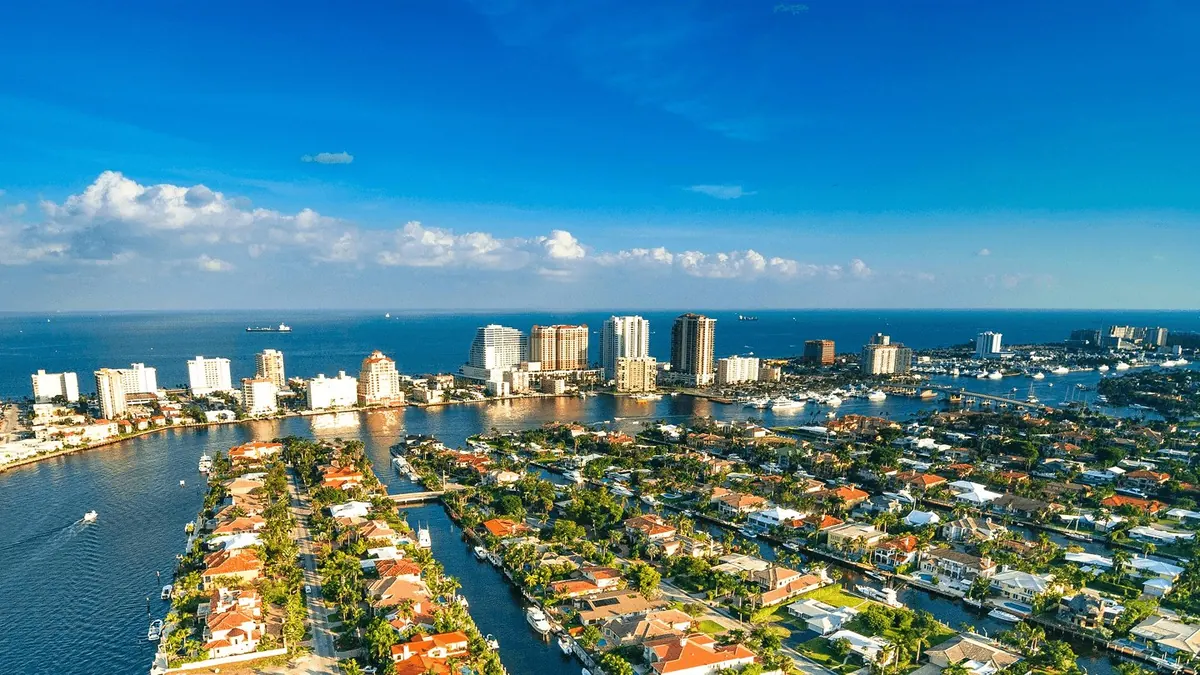
Available Properties
Commercial properties for sale in Fort Lauderdale
Live listings, updated continuously. Open the full search for map view and filters.


Local Office & Off-Market Deals
Off-market commercial real estate in Fort Lauderdale
GoCommercial, Fort Lauderdale
945 E Las Olas Boulevard
Fort Lauderdale, FL 33301
Contact us for off-market deals in Fort Lauderdale
Not every Fort Lauderdale property trades on the open market. Through Compass Private Exclusives and our direct relationships with local owners, we see opportunities before they are publicly listed. Tell us what you want to buy, your price range and your timing, and a senior advisor will share the private and off-market opportunities that fit.
Own property here and prefer a quiet sale? We can take it to qualified buyers confidentially, without a public listing.
Market Overview
Commercial real estate in Fort Lauderdale, Florida
GoCommercial covers Broward from our Las Olas Boulevard office, with advisors who work multifamily, industrial, office, retail and marine assignments countywide, and the Miami Beach office twenty-five minutes south.
What Drives Demand
Why Fort Lauderdale
01
Port and airport
Port Everglades is a top cargo and cruise port and FLL a major hub; both drive industrial, hospitality and service demand countywide.
02
Marine industry
The largest concentration of yacht service, refit and marina businesses in the world supports a unique set of waterfront and industrial assets.
03
Relative value
Pricing in Broward typically sits below Miami-Dade and Palm Beach for comparable product, which attracts investors seeking yield without leaving the urban core.
Submarkets & Corridors
Where the activity is
Downtown & Flagler Village
High-rise multifamily, office and street retail along Las Olas and the New River.
Port Everglades & I-95 corridor
Distribution, cold storage, cross-dock and outdoor storage from Dania Beach to Pompano.
Hollywood & Hallandale
Dense multifamily, hospitality and redevelopment sites along US-1 and the beach.
Plantation, Davie & Pembroke Pines
Suburban office, medical office, retail centers and garden apartments.
Pompano Beach & Deerfield Beach
Industrial, redevelopment along the Dixie Highway corridor and the Hillsboro Boulevard retail spine.
Asset Classes
What we sell and lease in Fort Lauderdale
All asset classes
Multifamily
Multifamily is the deepest part of GoCommercial's track record: stabilized communities, value-add properties, small buildings and portfolios, and large build-to-rent communities in every region of Florida.
Explore Multifamily
Industrial, Warehouse & Outdoor Storage
Florida's industrial market runs on logistics, population growth and a shortage of zoned land.
Explore Industrial, Warehouse & Outdoor Storage
Retail & Net Lease
From a single-tenant net lease property bought on a 1031 exchange to a grocery-anchored center, retail is a credit and location business.
Explore Retail & Net Lease
Office
Florida office is a tale of two markets: suburban, well-located buildings that owner-users and private investors want, and older product that needs repositioning.
Explore Office
Hospitality
Florida hospitality ranges from boutique coastal inns to interstate limited-service hotels, and each trades on a different buyer.
Explore Hospitality
Mixed-Use
Mixed-use assets combine the underwriting of several property types in one building.
Explore Mixed-UseOwn property here?
Sell your Fort Lauderdale property with a senior principal on your side.
A marketing approach you approve, public or private, institutional-grade materials, and one advisor from the first conversation through closing.
Market Data · CoStar
Market data: Fort Lauderdale
CoStar figures for the metro and the submarkets that cover Fort Lauderdale. Each table states its period and rent basis. Full Florida market report ›
GoCommercial Market Analysis · Fort Lauderdale
CoStar's current figures for Broward County, the market that covers Fort Lauderdale, put asking rents at office $36.30 per SF (+4.8%) with 11.7% vacancy, up 74 bps year over year; industrial $20.93 per SF (+1.5%) with 7.4% vacancy, up 95 bps year over year; retail $37.15 per SF (+2.0%) with 4.2% vacancy, up 41 bps year over year; and multifamily $2,353 per unit (+0.2%) with 7.1% vacancy, down 42 bps year over year.
Over the past 12 months, office absorbed −771K SF against −144K SF delivered, with 597K SF under construction (0.8% of inventory). Industrial absorbed −516K SF against 1.5M SF delivered, with 846K SF under construction (0.6% of inventory). Retail absorbed −293K SF against 42K SF delivered, with 806K SF under construction (0.7% of inventory). Multifamily absorbed 4,524 units against 4,019 units delivered, with 9,410 units under construction (6.3% of inventory).
Investment sales across the four property types totaled about $6.75B over the trailing 12 months across 1,261 transactions, at market cap rates of office 8.2%, industrial 6.7%, retail 6.2% and multifamily 5.7%.
Our read: Broward is the softest of the three South Florida counties right now. Office, industrial and retail all recorded negative absorption over the past year, office vacancy is the highest in the region at 11.7%, and industrial vacancy rose 95 bps on 1.5 million SF of deliveries. Multifamily is the exception, with 4,500 units absorbed and vacancy down. Owners with rollover in the next 18 months should plan for concessions; buyers will find more negotiability here than in Miami-Dade or Palm Beach.
Analysis by GoCommercial. Reviewed by Brad Kuskin, Founding Principal, on November 10, 2026.
GoCommercial analysis of CoStar market data, Q4 2026 quarter to date. Metro figures are CoStar's; multi-county figures are weighted by inventory. Updated each quarter as new data publishes.
Office
Broward County office asking rents average $36.30 per SF, +4.8% over the past 12 months. Vacancy is 11.7%, up from 10.9% a year earlier. The market absorbed −771K SF over the past year against −144K SF delivered, with 597K SF under construction. Investment sales over the trailing 12 months totaled about $756M across 286 transactions at a market cap rate of 8.2%.
| Market | Asking rent / SF | 12-mo change | Vacancy | 12-mo absorption | Under construction | Cap rate |
|---|---|---|---|---|---|---|
| Broward County | $36.30 | +4.8% | 11.7% | −771K SF | 597K SF | 8.2% |
| Downtown Fort Lauderdalesubmarket | $48.49 | +5.8% | 14.1% | −131K SF | 342K SF | 7.8% |
| Fort Lauderdalesubmarket | $32.66 | +4.8% | 11.9% | −196K SF | 0 SF | 8.1% |
| Southwest Browardsubmarket | $36.30 | +5.0% | 12.5% | −244K SF | 256K SF | 8.7% |
| Plantationsubmarket | $32.98 | +4.2% | 10.4% | −121K SF | 0 SF | 8.4% |
| Cypress Creeksubmarket | $31.59 | +5.1% | 12.1% | 79K SF | 0 SF | 8.3% |
| Pompano Beachsubmarket | $31.43 | +4.1% | 9.1% | −20K SF | 0 SF | 7.9% |
| Hollywoodsubmarket | $37.43 | +2.6% | 5.8% | 79K SF | 0 SF | 8.2% |
| Sawgrass Parksubmarket | $35.12 | +5.5% | 20.5% | −210K SF | 0 SF | 8.2% |
Source: CoStar, Florida Office market and submarket data, Broward County, Q4 2026 (quarter to date, retrieved November 2026). Market asking rent, $/SF/year, full-service equivalent. 12-month figures are trailing four quarters. Analysis and commentary by GoCommercial.
Broward County · asking rent and vacancy, Q4 each year
2021$30.1010.0% vacant
2022$31.999.8% vacant
2023$33.209.8% vacant
2024$33.849.7% vacant
2025$34.8310.9% vacant
2026$36.3011.7% vacant
The 12-month rent change shown above is the growth figure CoStar publishes for the quarter to date. It is not calculated from the yearly figures in this strip, so the two can differ slightly.
Industrial
Broward County industrial asking rents average $20.93 per SF, +1.5% over the past 12 months. Vacancy is 7.4%, up from 6.5% a year earlier. The market absorbed −516K SF over the past year against 1.5M SF delivered, with 846K SF under construction. Investment sales over the trailing 12 months totaled about $2.74B across 422 transactions at a market cap rate of 6.7%.
| Market | Asking rent / SF | 12-mo change | Vacancy | 12-mo absorption | Under construction | Cap rate |
|---|---|---|---|---|---|---|
| Broward County | $20.93 | +1.5% | 7.4% | −516K SF | 846K SF | 6.7% |
| Pompano Beachsubmarket | $19.62 | +1.4% | 8.8% | −276K SF | 493K SF | 6.7% |
| Southeast Browardsubmarket | $22.62 | +1.4% | 5.8% | 66K SF | 261K SF | 6.7% |
| Southwest Browardsubmarket | $20.92 | +2.1% | 6.6% | −48K SF | 0 SF | 6.4% |
| Central Browardsubmarket | $21.24 | +1.0% | 6.9% | −319K SF | 92K SF | 7.0% |
| Northeast Browardsubmarket | $19.62 | +1.7% | 8.2% | −116K SF | 0 SF | 6.6% |
| West Sunrisesubmarket | $20.92 | +1.9% | 10.7% | −187K SF | 0 SF | 6.5% |
Source: CoStar, Florida Industrial market and submarket data, Broward County, Q4 2026 (quarter to date, retrieved November 2026). Market asking rent, $/SF/year, triple net, all industrial subtypes. 12-month figures are trailing four quarters. Analysis and commentary by GoCommercial.
Retail
Broward County retail asking rents average $37.15 per SF, +2.0% over the past 12 months. Vacancy is 4.2%, up from 3.8% a year earlier. The market absorbed −293K SF over the past year against 42K SF delivered, with 806K SF under construction. Investment sales over the trailing 12 months totaled about $1.44B across 359 transactions at a market cap rate of 6.2%.
| Market | Asking rent / SF | 12-mo change | Vacancy | 12-mo absorption | Under construction | Cap rate |
|---|---|---|---|---|---|---|
| Broward County | $37.15 | +2.0% | 4.2% | −293K SF | 806K SF | 6.2% |
| Fort Lauderdalesubmarket | $34.16 | +1.9% | 4.7% | −29K SF | 40K SF | 6.1% |
| Southwest Browardsubmarket | $43.09 | +2.0% | 2.5% | −22K SF | 496K SF | 6.2% |
| Pompano Beachsubmarket | $34.54 | +1.8% | 5.1% | −103K SF | 143K SF | 6.1% |
| Plantationsubmarket | $33.23 | +1.9% | 4.4% | −121K SF | 0 SF | 6.2% |
| Hollywoodsubmarket | $37.82 | +1.8% | 4.5% | 61K SF | 121K SF | 6.2% |
| Sawgrass Parksubmarket | $41.67 | +2.9% | 1.3% | 23K SF | 0 SF | 6.1% |
| Downtown Fort Lauderdalesubmarket | $53.07 | +2.0% | 6.1% | −3K SF | 0 SF | 5.8% |
| Cypress Creeksubmarket | $33.64 | +2.7% | 3.2% | 15K SF | 0 SF | 6.1% |
Source: CoStar, Florida Retail market and submarket data, Broward County, Q4 2026 (quarter to date, retrieved November 2026). Market asking rent, $/SF/year, triple net. 12-month figures are trailing four quarters. Analysis and commentary by GoCommercial.
Multifamily
Broward County multifamily asking rents average $2,353 per unit per month, +0.2% over the past 12 months. Vacancy is 7.1%, down from 7.6% a year earlier. The market absorbed 4,524 units over the past year against 4,019 units delivered, with 9,410 units under construction. Investment sales over the trailing 12 months totaled about $1.81B across 194 transactions at a market cap rate of 5.7%.
| Market | Asking rent / unit | 12-mo change | Vacancy | 12-mo absorption | Under construction | Cap rate |
|---|---|---|---|---|---|---|
| Broward County | $2,353 | +0.2% | 7.1% | 4,524 units | 9,410 units | 5.7% |
| Central Fort Lauderdalesubmarket | $2,815 | −0.7% | 8.0% | 1,261 units | 1,428 units | 5.7% |
| Plantation/Sunrisesubmarket | $2,315 | +0.3% | 6.3% | 443 units | 739 units | 5.7% |
| Pompano Beach/Deerfield Beachsubmarket | $2,097 | +0.2% | 9.1% | 353 units | 0 units | 5.7% |
| Hollywood/Dania Beachsubmarket | $2,141 | +0.4% | 6.5% | 1,258 units | 453 units | 5.8% |
| Weston/Daviesubmarket | $2,487 | +1.2% | 7.3% | 321 units | 1,123 units | 5.8% |
Source: CoStar, Florida Multifamily market and submarket data, Broward County, Q4 2026 (quarter to date, retrieved November 2026). Market asking rent, $/unit/month; inventory, absorption and construction in units. 12-month figures are trailing four quarters. Analysis and commentary by GoCommercial.
Hospitality
| Market | ADR | Occupancy | RevPAR | 12-mo RevPAR change | Rooms | Under construction | Cap rate |
|---|---|---|---|---|---|---|---|
| Fort Lauderdale/Hollywood/Airportsubmarket | $179.69 | 74.0% | $132.89 | +6.9% | 19,440 | 303 rooms | 7.7% |
| Fort Lauderdale Beachsubmarket | $291.64 | 66.2% | $193.19 | +8.9% | 7,492 | 226 rooms | 6.9% |
| Coral Springs/Pompano Beachsubmarket | $152.73 | 67.4% | $102.90 | +6.7% | 6,103 | 480 rooms | 8.1% |
| West Broward/Plantationsubmarket | $135.86 | 77.0% | $104.61 | −9.4% | 6,051 | 585 rooms | 8.3% |
Source: CoStar, Florida Hospitality market and submarket data, Broward County, 12 months to September 2026 (monthly series, retrieved November 2026). Average daily rate, occupancy and RevPAR, trailing 12 months; inventory in rooms. Sales volume and transactions are trailing 12 months. Analysis and commentary by GoCommercial.
Nearby Markets
More of South Florida
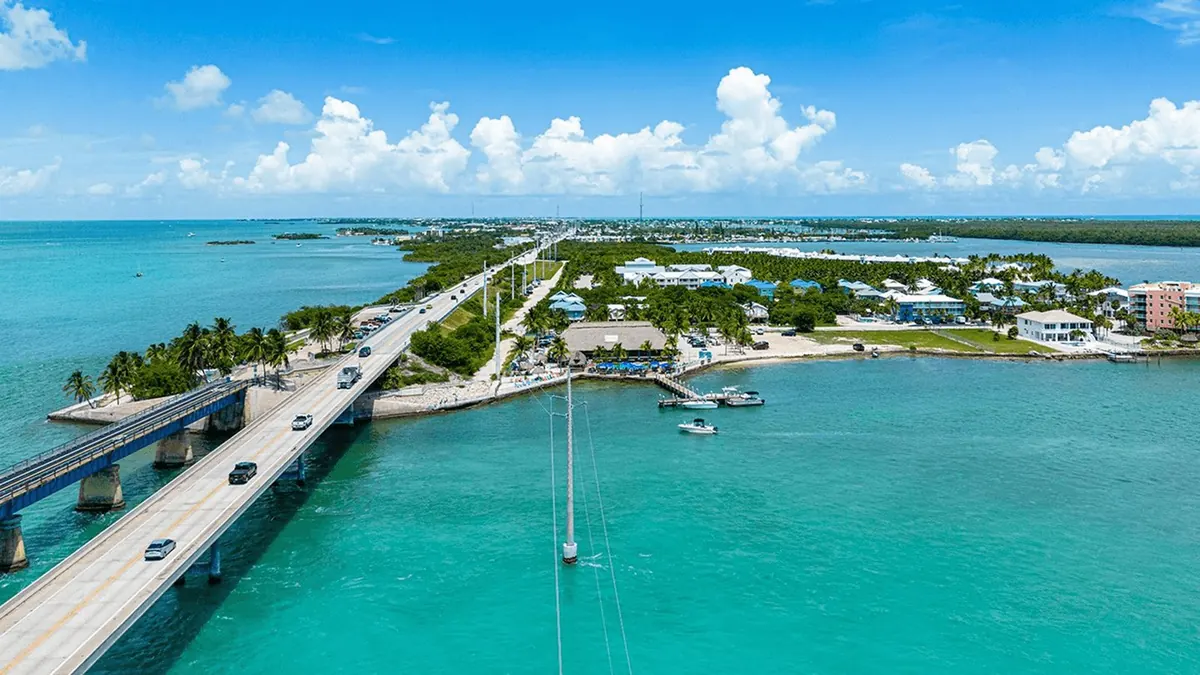
Monroe County
Florida Keys
Monroe County is a scarcity market unlike any other in Florida. We represent owners of hospitality, marina, retail and mixed-use property from…
Guide & Listings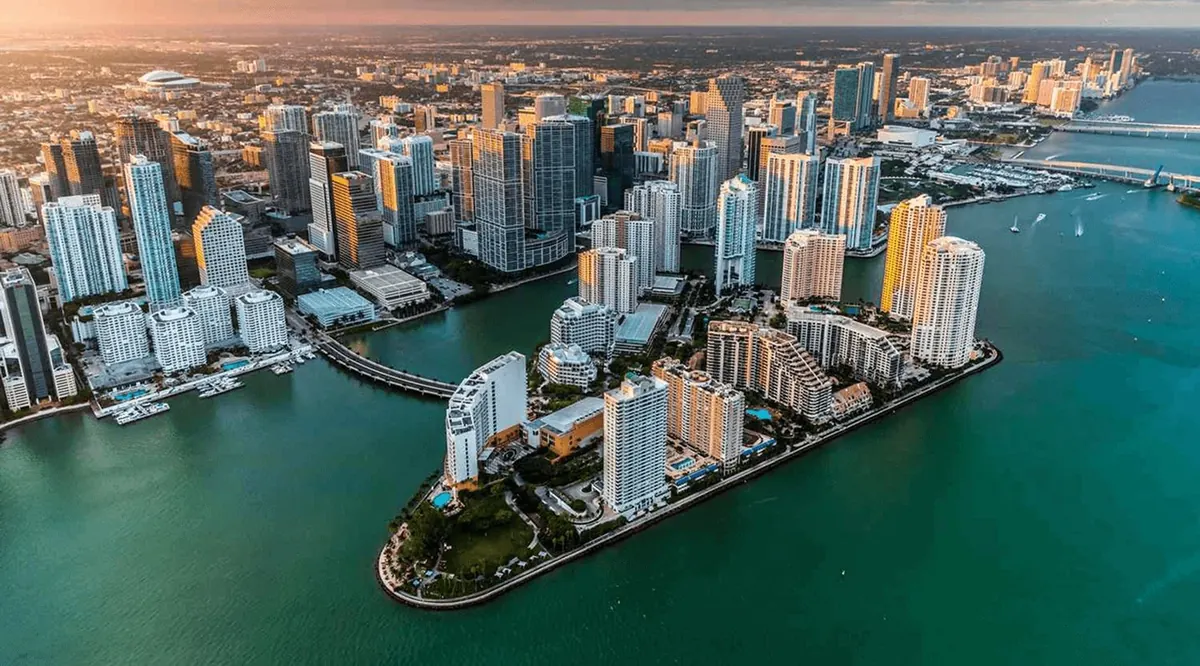
Miami-Dade County
Miami
From our Lincoln Road office, GoCommercial sells, leases and advises across Miami-Dade County, from Brickell and Wynwood to Doral, Hialeah and Homestead.
Guide & ListingsQuestions
Frequently asked
Who at GoCommercial covers Fort Lauderdale?
Our South Florida team, working from Fort Lauderdale, 945 E Las Olas Blvd, and Weston. A senior principal handles every Fort Lauderdale engagement personally, from valuation to closing, backed by Compass's 15 Florida offices and a national network licensed in all 50 states. Firmwide, GoCommercial has transacted in 37 of Florida's 67 counties.
Do you handle marine and waterfront commercial property?
Yes. Marinas, boatyards and waterfront mixed-use assets are a Broward specialty, and we track the national and international buyers for them.
Where is your Fort Lauderdale office?
Compass Fort Lauderdale Downtown at 945 East Las Olas Boulevard, with a second Broward office at 2500 Weston Road, Suite 404, in Weston.